
Concept Checks: Testing Sustainable Design Rules of Thumb
Methodology
The Concept Checks are based on a parametric energy study of a simplified office building in Stuttgart, Germany. The objective is not to reproduce one specific building in detail, but to create a controlled digital test environment in which early architectural decisions can be compared systematically.
The geometry and simulation workflow was developed in Rhino + Grasshopper. Building variants were generated parametrically by changing three main design variables: building shape, number of floors and window-to-wall ratio (WWR). Combining 7 geometric configurations, 5 floor counts and 7 WWR values produced a total of 245 design variants.
The building-energy model was created using Honeybee, which connects the Grasshopper geometry with EnergyPlus for dynamic annual energy simulation. A Stuttgart weather file was used to represent the local climatic conditions.
For every variant, the same general building-use and simulation assumptions were maintained so that the effect of geometric changes could be compared. The main outputs evaluated were:
Energy Use Intensity (EUI) [kWh/m²a]
Heating demand
Cooling demand
Lighting demand
Compactness A/V [1/m]
Envelope and glazing areas
Rather than analysing all simulations only through global correlations, the dataset is divided into controlled comparison groups. For example, when testing WWR, building shape and number of floors are held constant; when comparing alternative massing strategies, floor area and WWR are kept constant.
This allows each Concept Check to investigate a specific design question while reducing the influence of unrelated variables.
Architecture often relies on simple rules: compact buildings use less energy, more glazing improves daylight, and a low EUI means good performance.
These rules are useful, but buildings are systems. Changing one parameter usually affects several others.
For the first Zirkularis Concept Checks, we created 245 parametric energy simulations by combining 7 shapes, 5 floor counts and 7 window-to-wall ratios. Instead of looking only at correlations, we used controlled comparisons: keeping some variables constant while changing one design parameter at a time. This follows the logic of early-stage parametric simulation as a design-support method rather than only a verification tool [1].
CC01 — Does a more compact building always use less energy?
Compactness is expressed here as A/V [1/m]. A lower A/V means less envelope area relative to volume, which should generally reduce transmission losses [2].
But when we compared alternatives with the same 4,800 m² floor area and 30% WWR, the most compact option was not the lowest-energy option:
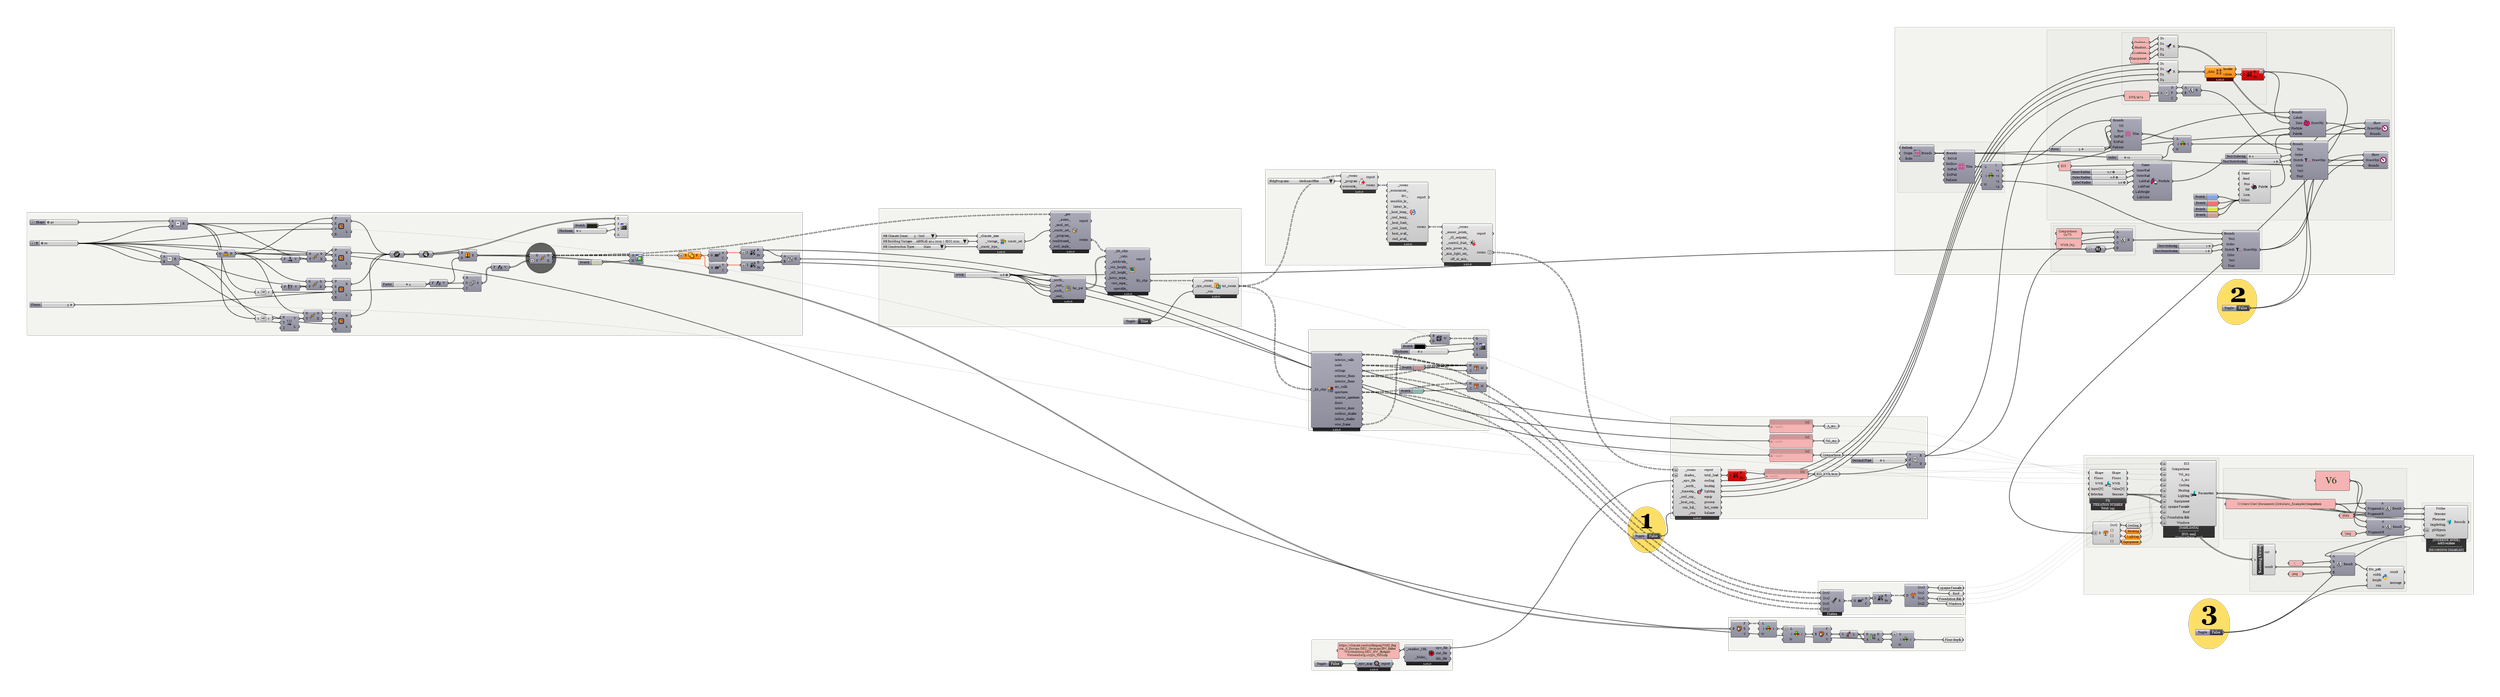
Parametric Script in Grashopper
From 3 floors to 1 floor, EUI fell by about 23%, while lighting demand increased slightly.
Takeaway: A/V is useful, but it cannot describe the full effect of geometry. Compactness is an indicator, not a design answer.
CC02 — How much glazing is too much?
More glazing reduces artificial-lighting demand, but also changes heating and cooling.
Across the dataset, increasing WWR from 0% to 10% reduced lighting demand by about 29%, enough to slightly reduce total EUI.
After that, the benefit rapidly diminished. From 30% to 60% WWR, lighting demand improved by only about 9%, while cooling increased by about 51%.
Research on WWR shows the same general pattern: the energy optimum depends on climate, orientation, glazing and shading rather than on one universal percentage [3,4].
Takeaway: The question is not “more or less glass?” but how much glazing is actually useful?
CC03 — Does the same WWR work for every building shape?
Not necessarily.
When WWR increased from 0% to 60%, the cooling response differed strongly between geometries:
Shape 40: +230% cooling
Shape 100: +65% cooling
The glazing ratio was the same, but the geometric context was different.
Takeaway: WWR should not be treated as an isolated target. Geometry and façade design need to be tested together.
CC04 — Can EUI hide a cooling problem?
Yes.
Across the full dataset, increasing WWR from 0% to 60% changed total EUI by only:
+6.6%
But underneath that number:
Heating: +16%
Cooling: +154%
Lighting: –52%
The reduction in lighting partly masks the increase in thermal loads.
Aggregate metrics such as EUI are useful for comparison, but they can hide very different performance profiles [5].
Takeaway: EUI tells us how much energy is used. The individual loads help explain why.
The broader lesson
The four Concept Checks point to the same conclusion:
Sustainable design is a multicriteria problem.
Compactness, glazing and EUI are valuable indicators, but none of them should be treated as a standalone design target.
The real value of early-stage simulation is to understand the trade-offs while the building is still easy to change.
One rule. One test. One clearer design decision.
References
[1] Samuelson, H. et al. (2016). Parametric energy simulation in early design: High-rise residential buildings in urban contexts. Building and Environment, 101, 19–31.
[2] Koźniewski, E. (2025). Assessment of Building Compactness at Initial Design Stage of Single-Family Houses. Energies, 18(13), 3569.
[3] Marino, C., Nucara, A., & Pietrafesa, M. (2017). Does window-to-wall ratio have a significant effect on the energy consumption of buildings? Journal of Building Engineering, 13, 169–183.
[4] Goia, F. (2016). Search for the optimal window-to-wall ratio in office buildings in different European climates. Solar Energy, 132, 467–492.
[5] O'Brien, W. et al. (2017). On occupant-centric building performance metrics. Building and Environment, 122, 373–385.
